Before we get into part 4 of this series, let’s have a quick recap of the previous parts. Session 1 was about professional development for teachers and a leaders’ role in that. Session 2 was about how to engage with parents and build a community that is based on trust. Session 3 was about personal safety education and picking relevant topics. Session 4 is about unlocking the power of data for school leaders. It’s also about how having and using data meaningfully can address a lot of problems. The data gathered in the past year is equivalent to the data gathered in the 15 years before that. We’ll also discuss about how to utilize it as school leaders.
The objectives of this webinar are:
- To define the term ‘data analytics’ and its relevance for your school
- To create a roadmap for your data analytics
- To describe the journey of a data analytics project
The last point includes defining a problem and finding a suitable solution for it. It also involves talking about some real-life examples.
What is Data?
Oxford dictionary defines it as ‘facts and statistics collected together for reference or analysis’. The different types of data include scientific, geographical, cultural, transport, financial, meteorological, etc.
What is Data Analytics?
Let’s take an example. We’re planning a vacation to Ooty. The first thing we do is plan out the route using maps. The data is the start and end locations, route data, traffic data, etc. Data analysis is choosing which route to take based on time, distance, and any other constraints we might have. It has 3 steps; insight prediction, and prescription. In this example, the insight is the distance from Chennai to Ooty. Prediction is the time taken for each route. Prescription is the best route suggested by maps. We’re able to analyze the data and draw a conclusion. Based on this, we take action. Action is driven by the user depending on factors that the data source is not aware of.
Schools usually deal with data like student and staff details, attendance, student performance, financial data, infrastructure (maintenance information, transport information), and social media data.
Hardcopy vs Digitised Data
One of the basics of data analytics is data digitization. Hardcopy is accessible only from school. It’s a hassle to process and there’s plenty of paperwork involved. Softcopy is accessible anywhere through cloud-based systems. It’s fast and easy to process and it has virtually no paperwork. In the past mathematicians have been doing this the old-fashioned way. But now, the digital revolution has given data analytics a level of simplicity and sophistication that even common people can do it. Without digitized data, data analytics would be challenging and time-consuming.
GIGO
It stands for garbage in garbage out. It means that the quality of input is going to affect the quality of output. A research shows that younger students (born in June) had the lowest academic parents. They find it tough to keep up with their peers. But if we assume that all the students are born on an arbitrary date with the same year, the analysis we do will not be accurate. So, it’s important to verify the kind and quality of data we collect. It’s up to us to change garbage in garbage out to gold in gold out.
Potential of Quality Digitized Data
The quality of the data collected determines how well we can use it. Let’s review some potentials of quality digitized data.
Accessing information with ease
Entering the marks for test subjectwise is data. Determining the overall academic performance of a student for that year is information. Collecting the date of joining of teachers is data. Finding out their work anniversaries based on that is information. If this data is a hard copy, it’ll be tedious for us to go through it and find out what we want, especially for schools with a large number of teachers and students. But with digitized data, we can find this out in minutes.
Finding answers to questions
We can find out answers to questions like ‘Is no of admissions increasing?’, ‘Which branch of my school is doing well?’ ‘What are the problems my school is facing?’. Depending on the result, we can either focus on the problem points or make plans for expansion.
Enhancing performance
We can use digitized data to improve regular processes like remediation, optimization, timetabling, etc. We can also factor in data that we haven’t considered before because we have digitized data that is already organized and ready to use.
Data Analytics Process
There are 4 steps in the data analytics process.
Define → Gather → Analyze → Act
1. Define
We should define the problem we’re trying to solve in a clear and precise manner. It can be things like ‘Who are the students we need to help?’, ‘What are the concepts they have difficulties in?’ and ‘How do we help them?’
2. Gather
We should gather relevant data from different sources depending on the problem. For problems like focussing on students that need our help and the areas they are having trouble with, collecting classwise and student performance scores across multiple learning outcomes in tests will help.
3. Analyze
We have to analyze the data properly for insights. We have to process it and bring it together in a usable form. It’s also known as data interpretation. For the above problem, we can find out which students have not achieved some LOs and in which subjects they haven’t achieved it.
4. Act
This is taking action and drawing conclusions based on the insights. We can form a remediation plan based on the insights from the analysis.
Bus Route Optimization Example
Let’s consider this non-academic example that is relevant to schools. We can define problems like ‘How can we minimize the travel distances and save costs?’ and ‘How to plan routes for multiple school buses?’. We can gather data like the number of buses available, the location of each stop, and the number of people in each stop. We can visually analyze the stops covered currently by buses using maps, and understand things like a smaller number of buses can be used for less populated routes. We can also create optimization models which will give suggested bus routes based on the input. After checking if the suggested bus routes are according to the school requirements, we can make changes, if needed, based on any other constraints and implement the optimization model.
Data Analytics at Chrysalis
The most often question asked at Chrysalis is ‘What is the customized Professional Development Module for your school?’. Data is gathered from the Thinkroom Participation forms. This information is updated in Chrysalis 1, a Customer Relationship Management system. The data can be summarised here. If 3 Think Room Participations are considered, we can easily see which TRPs are low, high, etc.
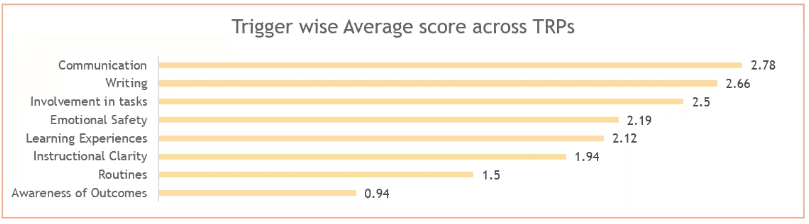
Since awareness of LO was low, it was decided that LO sessions would be conducted. The transformation partners have a conversation with the school coordinators to understand why there’s a gap, maybe because of some activity or process, like revision happening in the school, or a skill gap. Accordingly, we can decide what action can be taken. If we have to choose between routines and awareness but they’re really close together, talking about it will help in making a better decision. It’s a collaborative effort where we look at the data, share the insights and then decide what the Professional Development module could be.
Data Analytics at Chrysalis, Example 2
Another problem we have is ‘How can growth partners connect to our school quickly?’. We gather data like where are the schools, and how far are they from the growth partners’ base location. We noticed that many people were going to the same district. Also, there was an overlap in a few locations. Then, we created an optimization model using this data.
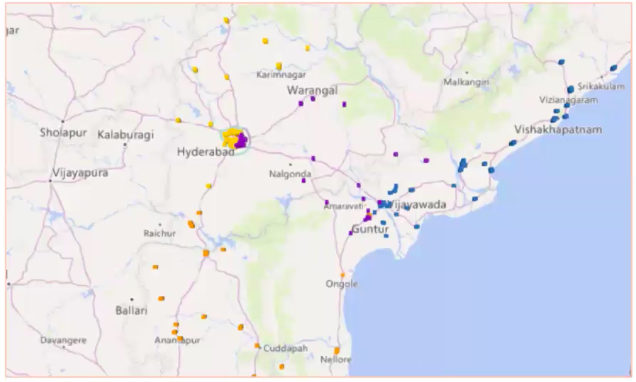
We took a hub and created a model based on the location of schools and growth partners. We determined how much distance one person can travel to cover the schools in that area and did the same for all the people. We used a statistics tool for creating this model. This system of school allocation reduced the travel distance considerably. The final allocations were made after a few practical factors were taken into consideration.
Role of School Leaders in Data Analytics
School leaders play a critical role in data analysis. They can do things like,
- Getting the basics in place; they can ensure the quality of the data collected and increase data digitization
- Defining the challenge or problem succinctly.
- Assigning teams that can gather and analyze the data who have the skills.
- Buying or subscribing to the necessary tools required for data collection and analysis.
- Take decisions and act based on the insights gathered. There will be some limitations on what data we can capture. In the data mining process, no one can say that they have the complete information for making the analysis. But, they can always try to be one step closer to having the complete data. As school leaders, they can pick and choose which data is relevant and take decisions accordingly.
- Ensuring data privacy. This includes asking questions like ‘How can we anonymize data?’, ‘How to share data only which is relevant to that person?’ and acting accordingly. For data analysis, things like student name are not required. A roll number is enough.
Role of Data Analytics Team
The basic skills needed are,
- Retrieving data from various sources
- Collating data from different sources
- Checking the data quality and clean if necessary
- Filtering, transforming, and creating new data points
- Visualizing data in the form of graphs, maps, etc and interpreting data
Advanced skills that are needed are to implement algorithms, optimization, and statistical models.
Data Bias
We have to beware of data bias that can happen at different levels. It can be in the form of a data source or data gaps that occur.
Summary Bias
Summaries don’t give a complete picture. We have to look at the upper and lower limit. We have to look at distribution. If we focus on mean and medians, then this is a limitation. It is also important not to draw a premature conclusion before the analysis is complete.
Recency Bias
Let’s consider an example of a student’s performance over an academic year.
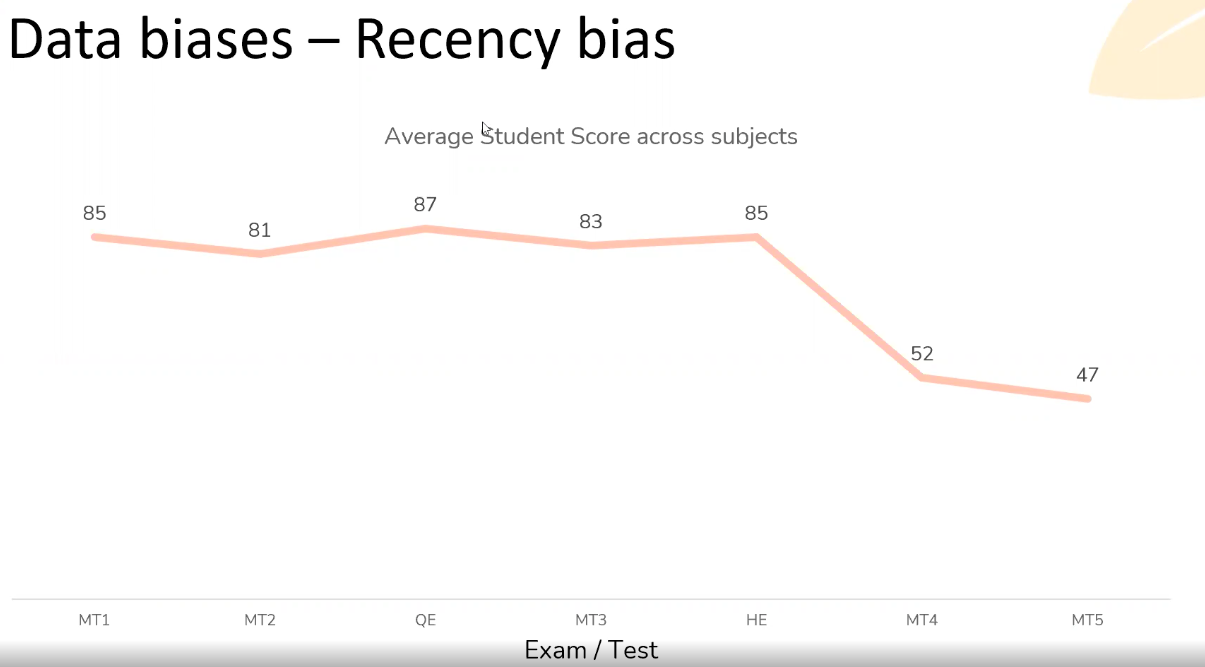
If we look only at the last two values, we will get the wrong idea that the student is not performing well based on it. But, if look at the overall data, we wouldn’t have that idea. The former is called a recency bias. It’s important to look at the data over a period of time and then draw a conclusion.
Tools for Data Analysis
The most basic tool is Excel. Enterprise Resouce Planning and Learning Management System tools can be used for data gathering in a structured way. ERP tools can be used for operational, non-academic parts of the school. Data can also be digitized in it. LMS tools can automate the data collection part like subjectwise data performance. It doesn’t require manual work.
Level of Sophistication of These Tools
The most basic requirement of a data analysis tool is to gather data in a structured way. They should also be able to,
- Provide reports as per our needs
- Provide insights
- Predict outcomes
- Prescribe solutions
If you’re on the market for data analysis tools, make sure that they have these key functions.
Summary
Here’s a review of the points discussed in this session.
- Data enables us to unearth insights and take actions based on them.
- Data digitization and quality are key points for successful data analysis.
- Data Analytics Process - Define → Gather → Analyse → Act.
- Role of school leaders and data analytics teams.
- Beware of possible data biases, they don’t stop at the summary level and ensure that they’re addressed during analysis.
- ERP & LMS tools can help by automating certain activities.
Watch the full recording of the webinar here in case you missed it!